

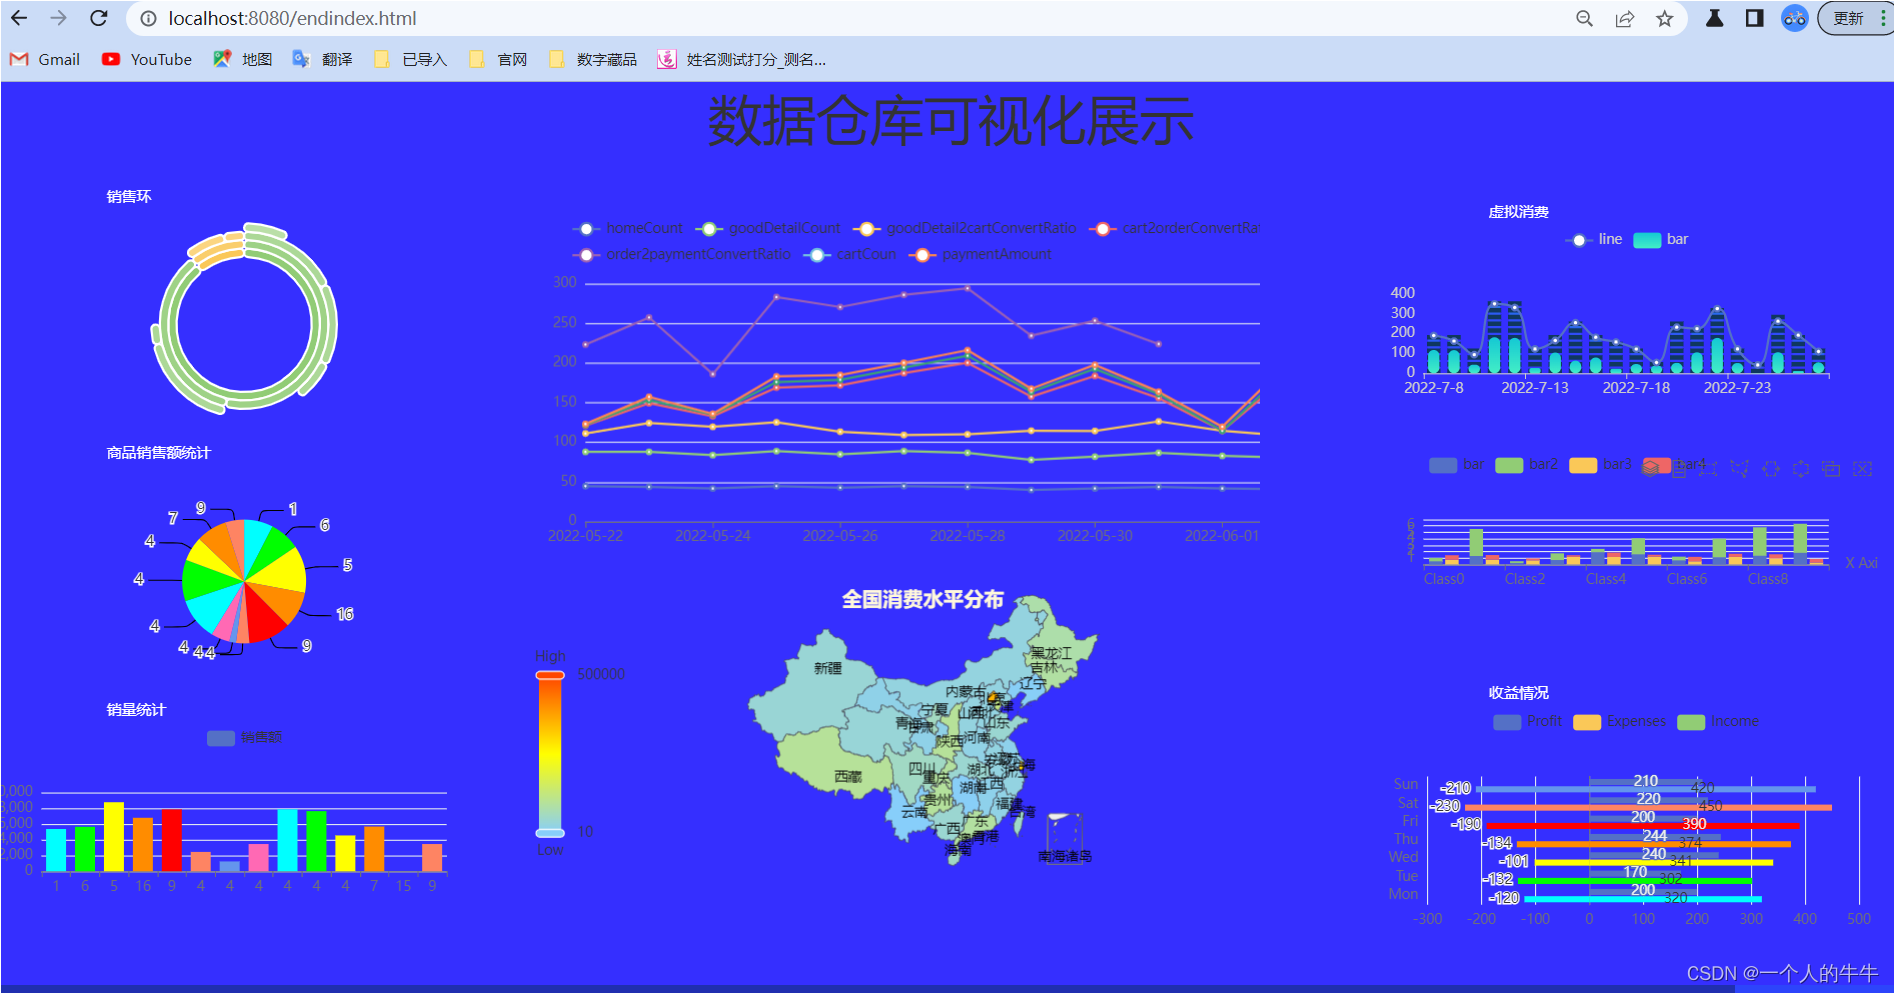
springboot+mybatis+echarts +mysql制作数据可视化大屏
发布于2023-06-20 21:47 阅读(1419) 评论(0) 点赞(0) 收藏(4)
作者水平低,如有错误,恳请指正!谢谢!!!!!
目录
成果展示:
一、数据源
1)可以使用自己的MySQL数据库;
2)使用我提供的数据。(免费下载)
gmall_report用于可视化的SQL文件-MySQL文档类资源-CSDN下载
二、所需工具
MySQL
IDEA
jdk1.8
Maven
三、项目框架搭建
3.1新建springboot项目
创建springboot项目有二种方式:
1)在IDEA中创建
2)在官网上创建
我喜欢在官网创建
3.1.1进入官网
官网地址(记得收藏):
3.1.2创建项目
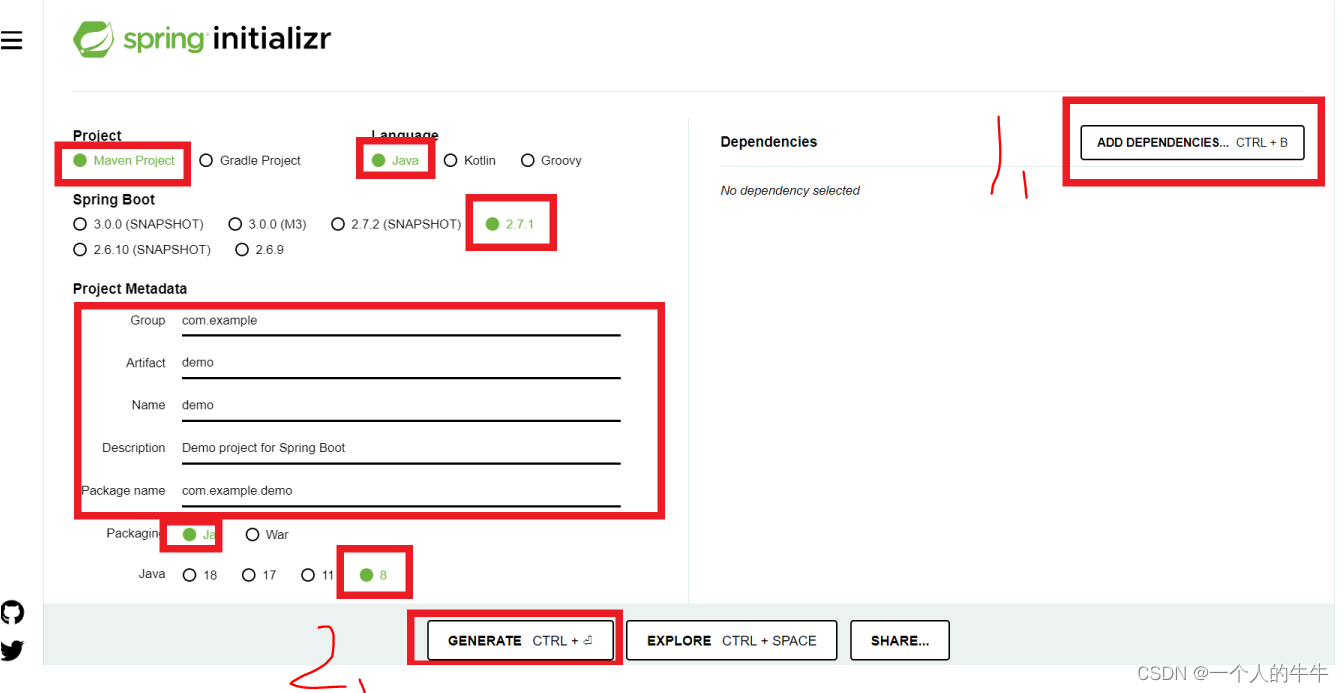
注:
1)注意红色框框的地方,选择你想要的版本和与你的计算机相应的配置;
2)在1.处点击添加相关依赖;
3)在2.处点击生成初始代码并下载。
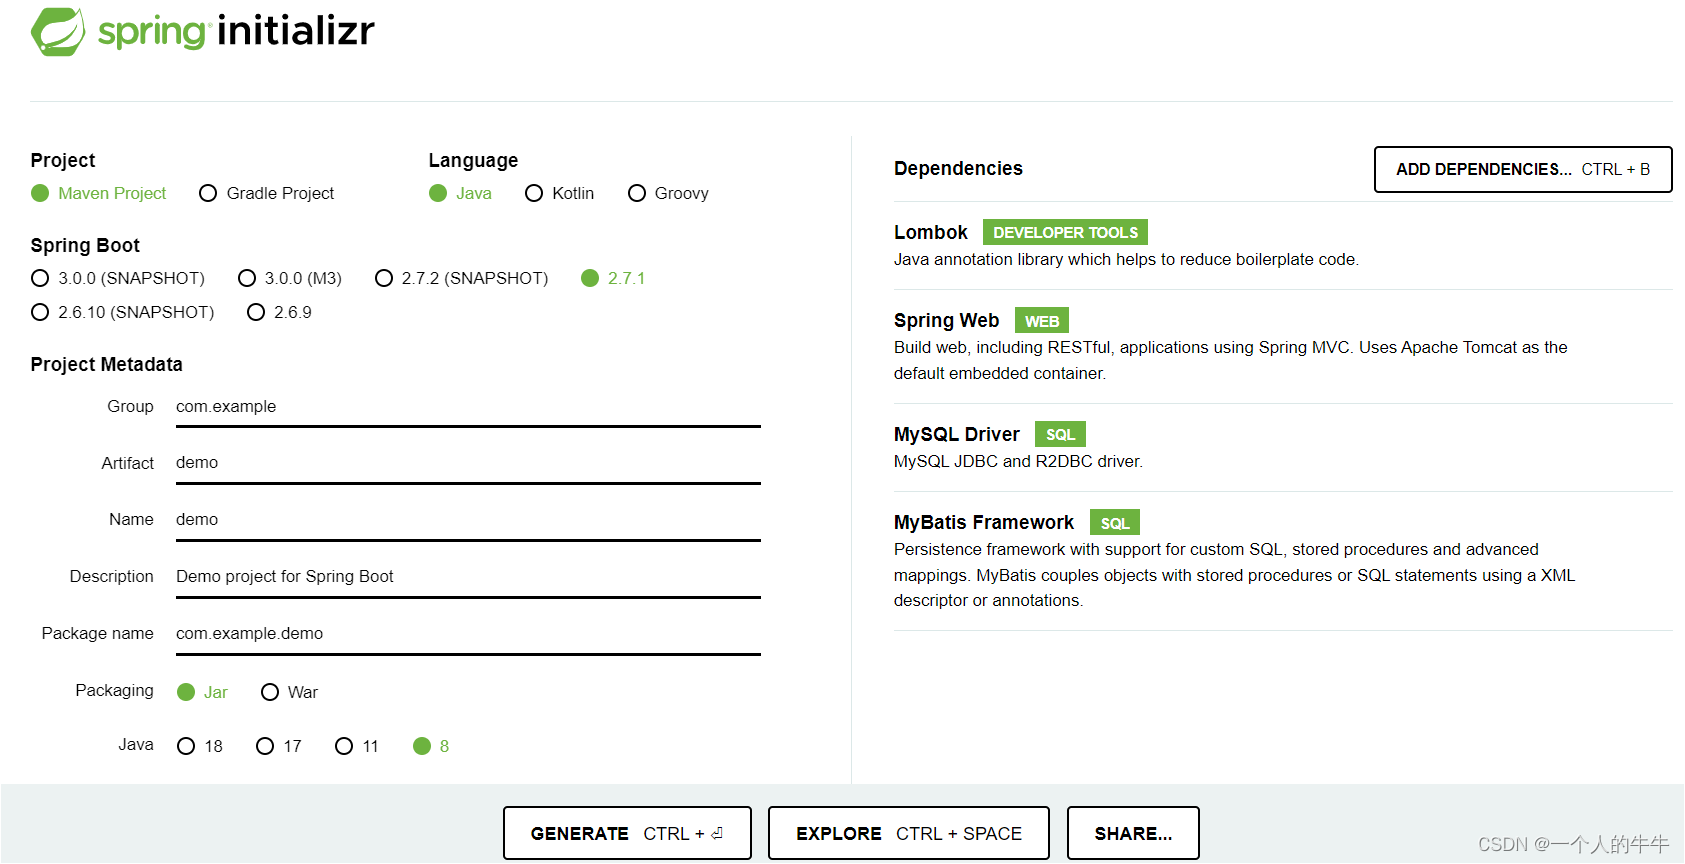
下面给出我的配置信息:
项目下载后解压,然后用IDEA打开解压后的项目。
四、后端代码编写
4.1根据需求修改pom.xml
我的pom.xml:
<?xml version="1.0" encoding="UTF-8"?>
<project xmlns="http://maven.apache.org/POM/4.0.0" xmlns:xsi="http://www.w3.org/2001/XMLSchema-instance"
   xsi:schemaLocation="http://maven.apache.org/POM/4.0.0 https://maven.apache.org/xsd/maven-4.0.0.xsd">
   <modelVersion>4.0.0</modelVersion>
   <parent>
      <groupId>org.springframework.boot</groupId>
      <artifactId>spring-boot-starter-parent</artifactId>
      <version>2.7.1</version>
      <relativePath/> <!-- lookup parent from repository -->
   </parent>
   <groupId>com.example</groupId>
   <artifactId>demo</artifactId>
   <version>0.0.1-SNAPSHOT</version>
   <name>demo</name>
   <description>Demo project for Spring Boot</description>
   <properties>
      <java.version>1.8</java.version>
   </properties>
   <dependencies>
      <dependency>
         <groupId>org.springframework.boot</groupId>
         <artifactId>spring-boot-starter-web</artifactId>
      </dependency>

      <dependency>
         <groupId>org.mybatis.spring.boot</groupId>
         <artifactId>mybatis-spring-boot-starter</artifactId>
         <version>2.2.2</version>
      </dependency>

      <dependency>
         <groupId>com.baomidou</groupId>
         <artifactId>mybatis-plus-boot-starter</artifactId>
         <version>3.1.2</version>
      </dependency>

      <dependency>
         <groupId>org.springframework.boot</groupId>
         <artifactId>spring-boot-devtools</artifactId>
         <scope>runtime</scope>
         <optional>true</optional>
      </dependency>

      <dependency>
         <groupId>mysql</groupId>
         <artifactId>mysql-connector-java</artifactId>
      </dependency>

      <dependency>
         <groupId>org.projectlombok</groupId>
         <artifactId>lombok</artifactId>
         <optional>true</optional>
         <version>1.18.4</version>
      </dependency>

      <dependency>
         <groupId>org.springframework.boot</groupId>
         <artifactId>spring-boot-starter-test</artifactId>
         <scope>test</scope>
      </dependency>

      <dependency>
         <groupId>org.springframework.boot</groupId>
         <artifactId>spring-boot-starter-thymeleaf</artifactId>
      </dependency>

   </dependencies>

   <build>
      <plugins>
         <plugin>
            <groupId>org.springframework.boot</groupId>
            <artifactId>spring-boot-maven-plugin</artifactId>
            <configuration>
               <excludes>
                  <exclude>
                     <groupId>org.projectlombok</groupId>
                     <artifactId>lombok</artifactId>
                  </exclude>
               </excludes>
            </configuration>
         </plugin>
      </plugins>
   </build>
1)
</project>

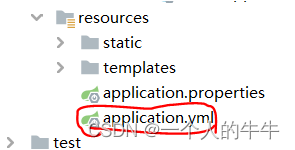
4.2配置数据源
1)重命名或者复制,把application.properties变为application.yml
2) 在application.yml中添加内容:
- spring:
- datasource:
- driver-class-name: com.mysql.cj.jdbc.Driver
- url: jdbc:mysql://192.168.17.XXX:3306/gmall_report?useUnicode=true&characterEncoding=UTF-8&serverTimezone=Asia/Shanghai&zeroDateTimeBehavior=CONVERT_TO_NULL
- username: root
- password: 123456
注:要按照实际情况修改内容。
(1)192.168.17.XXX是我的MySQL所在计算机的IP地址,要修改成你的;
(2)3306:是端口号;
(3)gmall_report是用到的数据库名;
(4)root是MySQL的用户名,123456是用户相应的密码;
4.3创建目录结构
按照下图创建你的包,使其目录和下图一样。
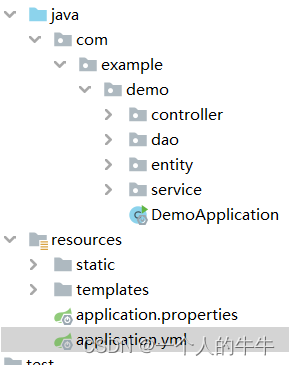
4.4后端编写代码
想要从MySQL中提取数据,要编写entity,dao,servier,controller类或者接口,强烈建议一张一张表的编写,方便梳理。
本文用到的表有:goods,ads_area_topic,ads_order_day_count,ads_product_sale_topN,ads_user_action_count
4.4.1entity类
在entity包下面创建java类,如下图;
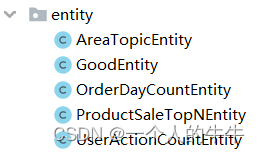
(1) AreaTopicEntity
- import com.baomidou.mybatisplus.annotation.TableId;
- import com.baomidou.mybatisplus.annotation.TableName;
- import lombok.Data;
-
- import java.io.Serializable;
-
- @Data
- @TableName("ads_area_topic")
- public class AreaTopicEntity implements Serializable {
- private static final long serialVersionUID = 2L;
-
- @TableId
- private String dt;
-
- private String id;
-
- private String provinceName;
-
- private String regionName;
-
- private String orderDayAmount;
-
- private String paymentDayAmount;
-
- private String areaCode;
- }
注:
1)ads_area_topic是用到的mysql表名;
2)dt , id, provinceName, regionDayAmouth, orderDayAmount, paymentDayAmount, areaCode;是ads_area_topic表的列名;
(2)GoodEntity
- import com.baomidou.mybatisplus.annotation.TableId;
- import com.baomidou.mybatisplus.annotation.TableName;
- import lombok.Data;
-
- import java.io.Serializable;
-
- @Data
- @TableName("goods")
- public class GoodEntity implements Serializable {
- private static final long serialVersionUID = 1L;
-
- @TableId
- private Long id;
-
- private String name;
-
- private Integer num;
-
- }
(3)OrderDayCountEntity
- import com.baomidou.mybatisplus.annotation.TableId;
- import com.baomidou.mybatisplus.annotation.TableName;
- import lombok.Data;
-
- import java.io.Serializable;
-
- @Data
- @TableName("ads_order_daycount")
- public class OrderDayCountEntity implements Serializable {
- private static final Long serialVersionUID = 1L;
-
- @TableId
- private String dt;
-
- private String orderCount;
-
- private String orderAmount;
-
- private String orderUsers;
- }
(4)ProductSaleTopNEntity
- import com.baomidou.mybatisplus.annotation.TableId;
- import com.baomidou.mybatisplus.annotation.TableName;
- import lombok.Data;
-
- import java.io.Serializable;
-
- @Data
- @TableName("ads_product_sale_topN")
- public class ProductSaleTopNEntity implements Serializable {
- private static final Long serialVersionUID = 1L;
-
- @TableId
- private String dt;
-
- private String skuId;
-
- private String paymentAmount;
- }
(5)UserActionCountEntity
- import com.baomidou.mybatisplus.annotation.TableField;
- import com.baomidou.mybatisplus.annotation.TableName;
- import lombok.Data;
-
- import javax.print.DocFlavor;
- import java.io.Serializable;
-
- @Data
- @TableName("ads_user_action_convert_day")
- public class UserActionCountEntity implements Serializable {
- private static final Long serialVersionUID = 1L;
-
- @TableField
- private String dt;
- private String homeCount;
- private String goodDetailCount;
- private String home2goodDetailConvertRatio;
- private String cartCount;
- private String goodDetail2cartConvertRatio;
- private String orderCount;
- private String cart2orderConvertRatio;
- private String paymentAmount;
- private String order2paymentConvertRatio;
-
- }
4.4.2dao
按照下图在dao包下面创建java接口文件;
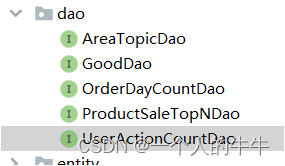
(1)AreaTopicDao
- import com.baomidou.mybatisplus.core.mapper.BaseMapper;
- import com.example.demo.entity.AreaTopicEntity;
- import org.apache.ibatis.annotations.Mapper;
-
- @Mapper
- public interface AreaTopicDao extends BaseMapper<AreaTopicEntity> {
- }
(2)GoodDao
- import com.baomidou.mybatisplus.core.mapper.BaseMapper;
- import com.example.demo.entity.GoodEntity;
- import org.apache.ibatis.annotations.Mapper;
-
- @Mapper
- public interface GoodDao extends BaseMapper<GoodEntity> {
- }
(3)OrderDayCountDao
- import com.baomidou.mybatisplus.core.mapper.BaseMapper;
- import com.example.demo.entity.OrderDayCountEntity;
- import org.apache.ibatis.annotations.Mapper;
-
- @Mapper
- public interface OrderDayCountDao extends BaseMapper<OrderDayCountEntity> {
- }
(4)ProductSaleTopNDao
- import com.baomidou.mybatisplus.core.mapper.BaseMapper;
- import com.example.demo.entity.ProductSaleTopNEntity;
- import org.apache.ibatis.annotations.Mapper;
-
- @Mapper
- public interface ProductSaleTopNDao extends BaseMapper<ProductSaleTopNEntity> {
- }
(5)UserActionCountDao
- import com.baomidou.mybatisplus.core.mapper.BaseMapper;
- import com.example.demo.entity.UserActionCountEntity;
- import org.apache.ibatis.annotations.Mapper;
-
- @Mapper
- public interface UserActionCountDao extends BaseMapper<UserActionCountEntity> {
- }
4.4.3service
1)在service包下创建一个impl包;
2)按照下图的布局在service和impl包下面创建java类和java接口文件
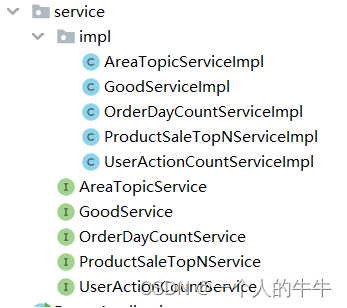
(1)AreaTopicService
- import com.baomidou.mybatisplus.extension.service.IService;
- import com.example.demo.entity.AreaTopicEntity;
-
- public interface AreaTopicService extends IService<AreaTopicEntity> {
- }
(1.1) AreaTopicServiceImpl
- import com.baomidou.mybatisplus.extension.service.impl.ServiceImpl;
- import com.example.demo.dao.AreaTopicDao;
- import com.example.demo.entity.AreaTopicEntity;
- import com.example.demo.service.AreaTopicService;
- import org.springframework.stereotype.Service;
-
- @Service("areatopicService")
- public class AreaTopicServiceImpl extends ServiceImpl<AreaTopicDao, AreaTopicEntity> implements AreaTopicService {
- }
(2)GoodService
- import com.baomidou.mybatisplus.extension.service.IService;
- import com.example.demo.entity.GoodEntity;
-
-
- public interface GoodService extends IService<GoodEntity> {
- }
(2.1)GoodServiceImpl
- import com.baomidou.mybatisplus.extension.service.impl.ServiceImpl;
- import com.example.demo.dao.GoodDao;
- import com.example.demo.entity.GoodEntity;
- import com.example.demo.service.GoodService;
- import org.springframework.stereotype.Service;
-
- @Service("goodService")
- public class GoodServiceImpl extends ServiceImpl<GoodDao, GoodEntity> implements GoodService {
- }
(3)OrderDayCountService
- import com.baomidou.mybatisplus.extension.service.IService;
- import com.example.demo.entity.OrderDayCountEntity;
-
- public interface OrderDayCountService extends IService<OrderDayCountEntity> {
- }
(3.1)OrderDayCountServiceImpl
- import com.baomidou.mybatisplus.extension.service.impl.ServiceImpl;
- import com.example.demo.dao.OrderDayCountDao;
- import com.example.demo.entity.OrderDayCountEntity;
- import com.example.demo.service.OrderDayCountService;
- import org.springframework.stereotype.Service;
-
- @Service("orderdaycountService")
- public class OrderDayCountServiceImpl extends ServiceImpl<OrderDayCountDao, OrderDayCountEntity> implements OrderDayCountService {
- }
(4)ProductSaleTopNService
- import com.baomidou.mybatisplus.extension.service.IService;
- import com.example.demo.entity.ProductSaleTopNEntity;
-
- public interface ProductSaleTopNService extends IService<ProductSaleTopNEntity> {
- }
(4.1)ProductSaleTopNServiceImpl
- import com.baomidou.mybatisplus.extension.service.impl.ServiceImpl;
- import com.example.demo.dao.ProductSaleTopNDao;
- import com.example.demo.entity.ProductSaleTopNEntity;
- import com.example.demo.service.ProductSaleTopNService;
- import org.springframework.stereotype.Service;
-
- @Service("productsaletopNService")
- public class ProductSaleTopNServiceImpl extends ServiceImpl<ProductSaleTopNDao, ProductSaleTopNEntity> implements ProductSaleTopNService {
- }
(5)UserActionCountService
- import com.baomidou.mybatisplus.extension.service.IService;
- import com.example.demo.entity.UserActionCountEntity;
-
- public interface UserActionCountService extends IService<UserActionCountEntity> {
- }
(5.1)UserActionCountServiceImpl
- import com.baomidou.mybatisplus.extension.service.impl.ServiceImpl;
- import com.example.demo.dao.UserActionCountDao;
- import com.example.demo.entity.UserActionCountEntity;
- import com.example.demo.service.UserActionCountService;
- import org.springframework.stereotype.Service;
-
- @Service("useractioncountService")
- public class UserActionCountServiceImpl extends ServiceImpl<UserActionCountDao, UserActionCountEntity> implements UserActionCountService {
- }
4.4.4controller
按照下图的布局在controller包下面创建java类文件;
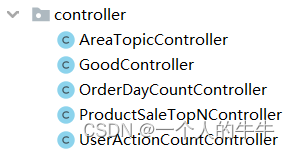
(1)AreaTopicController
- import com.example.demo.entity.AreaTopicEntity;
- import com.example.demo.service.AreaTopicService;
- import org.springframework.beans.factory.annotation.Autowired;
- import org.springframework.web.bind.annotation.RequestMapping;
- import org.springframework.web.bind.annotation.RestController;
-
- import java.util.List;
-
- @RestController
- @RequestMapping("areatopic")
- public class AreaTopicController {
- @Autowired
- private AreaTopicService areaTopicService;
-
- @RequestMapping("list")
- public List<AreaTopicEntity> list(){
- return areaTopicService.list();
- }
- }
(2) GoodController
- import com.example.demo.entity.GoodEntity;
- import com.example.demo.service.GoodService;
- import org.springframework.beans.factory.annotation.Autowired;
- import org.springframework.web.bind.annotation.RequestMapping;
- import org.springframework.web.bind.annotation.RestController;
-
- import java.util.List;
-
- @RestController
- @RequestMapping("goods")
- public class GoodController {
-
- @Autowired
- private GoodService goodService;
-
- @RequestMapping("list")
- public List<GoodEntity> list() {
-
- return goodService.list();
- }
- }
(3)OrderDayCountController
- import com.example.demo.entity.OrderDayCountEntity;
- import com.example.demo.service.OrderDayCountService;
- import org.springframework.beans.factory.annotation.Autowired;
- import org.springframework.web.bind.annotation.RequestMapping;
- import org.springframework.web.bind.annotation.RestController;
-
- import java.util.List;
-
- @RestController
- @RequestMapping("orderdaycount")
- public class OrderDayCountController {
-
- @Autowired
- private OrderDayCountService orderdaycountService;
-
- @RequestMapping("list")
- public List<OrderDayCountEntity> list(){
- return orderdaycountService.list();
- }
- }
(4)ProductSaleTopNController
- import com.example.demo.entity.ProductSaleTopNEntity;
- import com.example.demo.service.ProductSaleTopNService;
- import org.springframework.beans.factory.annotation.Autowired;
- import org.springframework.web.bind.annotation.RequestMapping;
- import org.springframework.web.bind.annotation.RestController;
-
- import java.util.List;
-
- @RestController
- @RequestMapping("productsaletopN")
- public class ProductSaleTopNController {
-
- @Autowired
- private ProductSaleTopNService productSaleTopNService;
-
- @RequestMapping("list")
- public List<ProductSaleTopNEntity> list(){
- return productSaleTopNService.list();
- }
- }
(5)UserActionCountController
- import com.example.demo.entity.UserActionCountEntity;
- import com.example.demo.service.UserActionCountService;
- import org.springframework.beans.factory.annotation.Autowired;
- import org.springframework.web.bind.annotation.RequestMapping;
- import org.springframework.web.bind.annotation.RestController;
-
- import java.util.List;
-
- @RestController
- @RequestMapping("useractioncount")
- public class UserActionCountController {
-
- @Autowired
- private UserActionCountService userActionCountService;
- @RequestMapping("list")
- public List<UserActionCountEntity> list(){
- return userActionCountService.list();
- }
- }
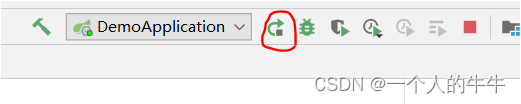
4.5测试
1)点击启动项目
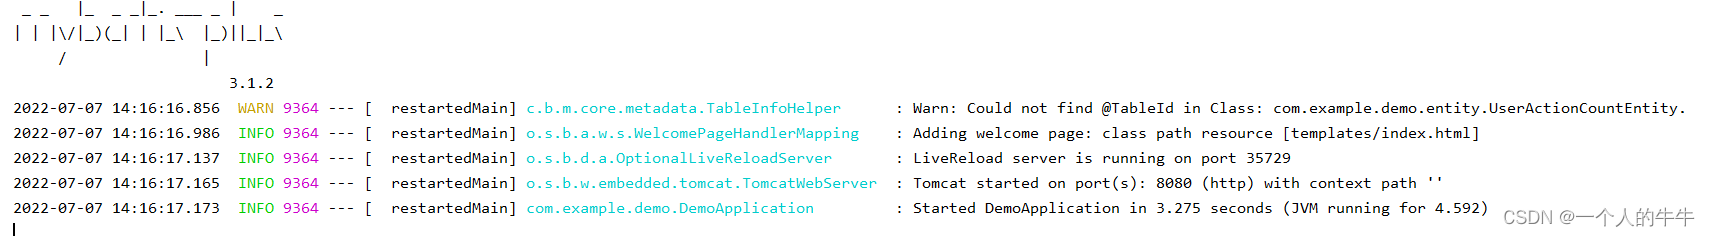
2)启动成功样式
3)进入浏览器,测试接口
- http://localhost:8080/areatopic/list
- http://localhost:8080/goods/list
- http://localhost:8080/orderdaycount/list
- http://localhost:8080/productsaletopN/list
- http://localhost:8080/useractioncount/list
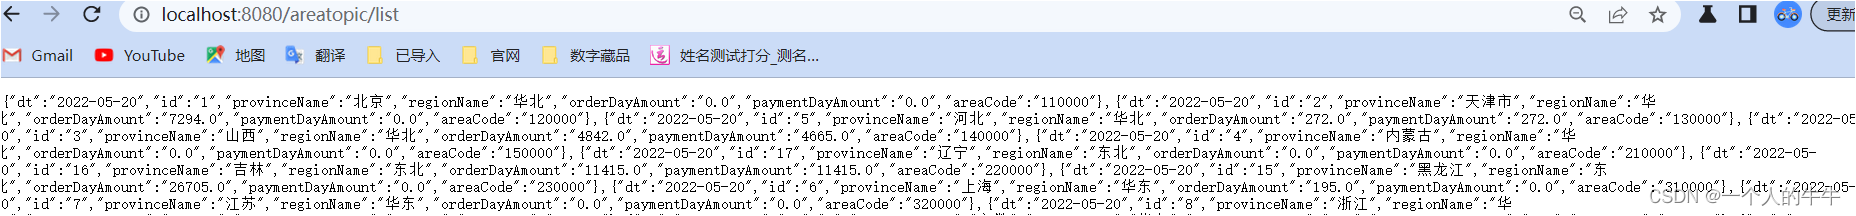

注:
注意查看数据,都出现数据说明上面的代码没有问题!
如果有数据为空,先检查mysql数据库的数据有没有问题,没有问题再检查相应的entity的代码;
注意,如果数据库表的列名中有下划线,entity中下划线的后一位要用大写,不能用下划线;
比如:
id_user --------->idUser
gmall_ip_use -------------->gmallIpUse
五、前端代码编写
5.1准备
下载echarts.min.js,jquery-3.5.1.min.js.china.js
1)通过以下官网可以找到:
2)知道大家下载麻烦,我已经准备了好了,内含用到的css!免费下载哦!
echarts,jQuery文件-Javascript文档类资源-CSDN下载
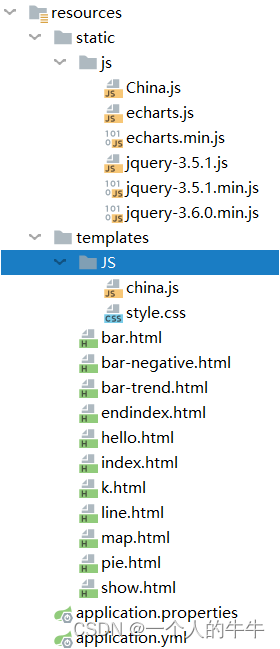
5.2创建包
按照下面结构创建相应的文件和文件夹;
5.3代码编写
5.3.1配置静态资源访问
在properties.yml中添加
- resources:
- web:
- resources:
- static-locations: classpath:/templates/, classpath:/static/
5.3.2在templates目录下创建HTML文件
k.html
- <!DOCTYPE html>
- <html>
- <head>
- <meta charset="utf-8">
- <title>柱状图</title>
- <!-- 引入 echarts.js -->
- <script src="/js/echarts.min.js"></script>
- <script src="/js/jquery-3.5.1.min.js"></script>
- </head>
- <body>
- <!-- 为ECharts准备一个具备大小(宽高)的Dom -->
- <div id="main" style="width: 450px;height:200px;"></div>
- <script type="text/javascript">
-
- var chartDom = document.getElementById('main');
- var myChart = echarts.init(chartDom);
- var option;
-
- var data = [
- {
- name: 'Grandpa',
- children: [
- {
- name: 'Uncle Leo',
- value: 15,
- children: [
- {
- name: 'Cousin Jack',
- value: 2
- },
- {
- name: 'Cousin Mary',
- value: 5,
- children: [
- {
- name: 'Jackson',
- value: 2
- }
- ]
- },
- {
- name: 'Cousin Ben',
- value: 4
- }
- ]
- },
- {
- name: 'Father',
- value: 10,
- children: [
- {
- name: 'Me',
- value: 5
- },
- {
- name: 'Brother Peter',
- value: 1
- }
- ]
- }
- ]
- },
- {
- name: 'Nancy',
- children: [
- {
- name: 'Uncle Nike',
- children: [
- {
- name: 'Cousin Betty',
- value: 1
- },
- {
- name: 'Cousin Jenny',
- value: 2
- }
- ]
- }
- ]
- }
- ];
- option = {
- series: {
-
- type: 'sunburst',
- data: data,
- radius: [60, '90%'],
- itemStyle: {
- borderRadius: 7,
- borderWidth: 2
- },
- label: {
- show: false
- }
- }
- };
-
- option && myChart.setOption(option);
-
- </script>
- </body>
pie.html
- <!DOCTYPE html>
- <html lang="en">
-
- <head>
- <meta charset="UTF-8">
- <meta name="viewport" content="width=device-width, initial-scale=1.0">
- <title>饼状图</title>
- <script src="/js/echarts.min.js"></script>
- <script src="/js/jquery-3.5.1.min.js"></script>
- </head>
-
- <body>
- <!-- 为ECharts准备一个具备大小(宽高)的Dom -->
- <div id="main" style="width:450px; height:200px;"></div>
- <script type="text/javascript">
- window.onload = function pie() {
- // 基于准备好的dom,初始化echarts实例
- var myChart = echarts.init(document.getElementById('main'));
-
-
- myChart.showLoading(); //数据加载完之前先显示一段简单的loading动画
- //声明一个对象
- var list = [];
- var nus = [];
- $.ajax({
- async: true, //异步请求
- data: {},
- //请求方式get
- type: "GET",
- //请求地址
- url: "/productsaletopN/list",
- //数据,json字符串
- dataType: "json",
- //请求成功
- success: function (result) {
- console.log(result);
- //进行数据的遍历
- $.each(result, function (index, item) {
- //添加数据到对象
- //物品名
- list.push(item.skuId);
- //物品名和数量
- nus.push({
- value: item.paymentAmount,
- name: item.skuId
- });
- });
- console.log(list);
- console.log(nus);
- myChart.hideLoading(); //隐藏加载动画
-
- var option = {
- title: {
- text: '',
- left: 'center'
- },
-
- tooltip: {
- trigger: 'item',
- formatter: '{a} <br/>{b}: {c} ({d}%)'
- // 计算占比%
- },
-
- legend: { //旁边的小标图
- orient: 'vertical',
- right: 10,
- top: 300,
- //添加物品名
- data: list
- },
- series: [
- {
- name: '访问来源',
- type: 'pie', // 设置图表类型为饼图
- radius: '55%', //饼图的半径,外半径为可视区尺寸的长度。
- // roseType: 'angle', //设置图表类型为南丁格尔图
- avoidLabelOverlap: false,
- emphasis: {
- label: {
- show: true,
- fontSize: '30',
- fontWeight: 'bold'
- }
- },
- labelLine: {
- lineStyle: {
- color: ''
- // color: 'rgba(200, 0, 255, 0.3)'
- },
- smooth: 0.2,
- length: 10,
- length2: 20
-
- },
-
- itemStyle: {
- emphasis: {
- shadowBlur: 10,
- shadowOffsetX: 0,
- shadowColor: 'rgba(0, 0, 0, 0.5)'
- },
- normal:{
- color:function(params) {
- //自定义颜色
- var colorList = ['#00FFFF', '#00FF00', '#FFFF00', '#FF8C00', '#FF0000', '#FE8463','#6495ed','#ff69b4','#00FFFF', '#00FF00', '#FFFF00', '#FF8C00', '#FF0000', '#FE8463','#6495ed','#ff69b4'];
- return colorList[params.dataIndex]
- }
- }
- },
-
- data: nus
- }
- ]
- };
- myChart.setOption(option);
- },
- error: function (errorMsg) {
- //请求失败时执行该函数
- alert("图表请求数据失败!");
- myChart.hideLoading();
- }
- });
- };
- </script>
- </body>
- </html>
index.html
- <!DOCTYPE html>
- <html>
- <head>
- <meta charset="utf-8">
- <title>柱状图</title>
- <!-- 引入 echarts.js -->
- <script src="/js/echarts.min.js"></script>
- <script src="/js/jquery-3.5.1.min.js"></script>
- </head>
- <body>
- <!-- 为ECharts准备一个具备大小(宽高)的Dom -->
- <div id="main" style="width: 450px;height:200px;"></div>
- <script type="text/javascript">
- // 基于准备好的dom,初始化echarts实例
- var myChart = echarts.init(document.getElementById('main'));
-
- // 指定图表的配置项和数据
- var option = {
- title: {
- text: ''
- },
-
- legend: {
- data:['销售额']
- },
- xAxis: {
- data: {}
- },
- yAxis: {},
- series: [{
- name: '销售额',
- type: 'bar',
- itemStyle: {
- emphasis: {
- shadowBlur: 10,
- shadowOffsetX: 0,
- shadowColor: 'rgba(0, 0, 0, 0.5)'
- },
- normal:{
- color:function(params) {
- //自定义颜色
- var colorList = ['#00FFFF', '#00FF00', '#FFFF00', '#FF8C00', '#FF0000', '#FE8463','#6495ed','#ff69b4','#00FFFF', '#00FF00', '#FFFF00', '#FF8C00', '#FF0000', '#FE8463','#6495ed','#ff69b4'];
- return colorList[params.dataIndex]
- }
- }
- },
- data: {}
- }]
- };
-
- var names=[];
- var nums=[];
-
- $.ajax({
- type: "get",
- url: "/productsaletopN/list",
- contentType: "application/json",
- success: function (res) {
- console.log("====res:=====")
- console.log(res);
- for (var i = 0; i < res.length; i++) {
- names.push(res[i].skuId);
- nums.push(res[i].paymentAmount);
- }
- myChart.setOption({
- xAxis: {data: names},
- series: [{name: '销售额',
- itemStyle: {
- emphasis: {
- shadowBlur: 10,
- shadowOffsetX: 0,
- shadowColor: 'rgba(0, 0, 0, 0.5)'
- },
- normal:{
- color:function(params) {
- //自定义颜色
- var colorList = ['#00FFFF', '#00FF00', '#FFFF00', '#FF8C00', '#FF0000', '#FE8463','#6495ed','#ff69b4','#00FFFF', '#00FF00', '#FFFF00', '#FF8C00', '#FF0000', '#FE8463','#6495ed','#ff69b4'];
- return colorList[params.dataIndex]
- }
- }
- },
- data: nums}]
- });
- }
- });
-
- // 使用刚指定的配置项和数据显示图表。
- myChart.setOption(option);
- </script>
- </body>
line.html
- <!DOCTYPE html>
- <html>
- <head>
- <meta charset="utf-8">
- <title>ECharts</title>
- <!-- 引入 echarts.js -->
- <script src="/js/echarts.min.js"></script>
- <script src="/js/jquery-3.5.1.min.js"></script>
- </head>
- <body>
- <!-- 为ECharts准备一个具备大小(宽高)的Dom -->
- <div id="main" style="width: 700px;height:300px;"></div>
- <script type="text/javascript">
- // 基于准备好的dom,初始化echarts实例
- // var myChart = echarts.init(document.getElementById('main'));
- var chartDom = document.getElementById('main');
- var myChart = echarts.init(chartDom);
- var option;
-
- var dts=[];
- var homeCounts=[];
- var goodDetailCounts=[];
- var goodDetail2cartConvertRatios=[];
- var cart2orderConvertRatios=[];
- var order2paymentConvertRatios=[];
-
- var cartCouns=[];
- var orderCounts=[];
- var paymentAmounts=[];
-
-
- $.ajax({
- type: "get",
- url: "/useractioncount/list",
- contentType: "application/json",
- success: function (res) {
- console.log("====res:=====")
- console.log(res);
- for (var i = 0; i < res.length; i++) {
- dts.push(res[i].dt);
- homeCounts.push(res[i].homeCount);
- goodDetailCounts.push(res[i]. goodDetailCount);
- goodDetail2cartConvertRatios.push(res[i].goodDetail2cartConvertRatio);
- cart2orderConvertRatios.push(res[i].cart2orderConvertRatio);
- order2paymentConvertRatios.push(res[i].order2paymentConvertRatio);
- cartCouns.push(res[i].cartCoun);
- orderCounts.push(res[i].orderCount);
- paymentAmounts.push(res[i].paymentAmount);
- };
-
- option = {
- title: {
- text: ''
- },
- tooltip: {
- trigger: 'axis'
- },
- legend: {
- data: ['homeCount', 'goodDetailCount', 'goodDetail2cartConvertRatio', 'cart2orderConvertRatio', 'order2paymentConvertRatio','cartCoun','orderCounts','paymentAmount']
- },
- grid: {
- left: '3%',
- right: '4%',
- bottom: '3%',
- containLabel: true
- },
- toolbox: {
- feature: {
- saveAsImage: {}
- }
- },
- xAxis: {
- type: 'category',
- boundaryGap: false,
- data:dts
- },
- yAxis: {
- type: 'value'
- },
-
- itemStyle: {
- emphasis: {
- shadowBlur: 10,
- shadowOffsetX: 0,
- shadowColor: 'rgba(0, 0, 0, 0.5)'
- },
- normal:{
- color:function(params) {
- //自定义颜色
- var colorList = ['#00FFFF', '#00FF00', '#FFFF00', '#FF8C00', '#FF0000', '#FE8463','#6495ed','#ff69b4'];
- return colorList[params.dataIndex]
- }
- }
- },
- series: [
-
- {
- name: 'homeCount',
- type: 'line',
- stack: 'Total',
- data: homeCounts
- },
- {
- name: 'goodDetailCount',
- type: 'line',
- stack: 'Total',
- data: goodDetailCounts
- },
- {
- name: 'goodDetail2cartConvertRatio',
- type: 'line',
- stack: 'Total',
- data: goodDetail2cartConvertRatios
- },
- {
- name: 'cart2orderConvertRatio',
- type: 'line',
- stack: 'Total',
- data: cart2orderConvertRatios
- },
- {
- name: 'cartCoun',
- type: 'line',
- stack: 'Total',
- data: cartCouns
- },
- {
- name: 'orderCount',
- type: 'line',
- stack: 'Total',
- data: orderCounts
- },
- {
- name: 'paymentAmount',
- type: 'line',
- stack: 'Total',
- data: paymentAmounts
- },
- {
- name: 'order2paymentConvertRatio',
- type: 'line',
- stack: 'Total',
- data: order2paymentConvertRatios
- }
- ]
- };
-
- option && myChart.setOption(option);
- }
- });
-
- </script>
- </body>
map.html
- <!DOCTYPE html>
- <html>
- <head>
- <meta charset="utf-8">
- <title>地图</title>
- <script src="/js/echarts.min.js"></script>
- <script src="/js/jquery-3.5.1.min.js"></script>
- <script src="/JS/china.js"></script>
-
- </head>
- <body >
- <div id="box" style="width: 700px; height: 300px;"></div>
- <script>
- // 初始化echarts实例
- var myEcharts = echarts.init(document.getElementById("box"));
-
- var option = {
- title: { //标题样式
- text: '全国消费水平分布',
- x: "center",
- textStyle: {
- fontSize: 18,
- color: "cornsilk"
- },
- },
- tooltip: { //这里设置提示框
- trigger: 'item', //数据项图形触发
- backgroundColor: "red", //提示框浮层的背景颜色。
- //字符串模板(地图): {a}(系列名称),{b}(区域名称),{c}(合并数值),{d}(无)
- formatter: '地区:{b}<br/>模拟数据:{c}'
- },
- visualMap: {//视觉映射组件
- top: 'center',
- left: 'left',
- min: 10,
- max: 500000,
- text: ['High', 'Low'],
- realtime: false, //拖拽时,是否实时更新
- calculable: true, //是否显示拖拽用的手柄
- inRange: {
- color: ['lightskyblue', 'yellow', 'orangered']
- }
- },
- series: [
- {
- name: '模拟数据',
- type: 'map',
- mapType: 'china',
- roam: false,//是否开启鼠标缩放和平移漫游
- itemStyle: {//地图区域的多边形 图形样式
- normal: {//是图形在默认状态下的样式
- label: {
- show: true,//是否显示标签
- textStyle: {
- color: "black"
- }
- }
- },
- zoom: 1.5, //地图缩放比例,默认为1
- emphasis: {//是图形在高亮状态下的样式,比如在鼠标悬浮或者图例联动高亮时
- label: { show: true }
- }
- },
- top: "3%",//组件距离容器的距离
- data: [
- { name: '北京', value: 350000 },
- { name: '天津', value: 120000 },
- { name: '上海', value: 300000 },
- { name: '重庆', value: 92000 },
- { name: '河北', value: 25000 },
- { name: '河南', value: 20000 },
- { name: '云南', value: 500 },
- { name: '辽宁', value: 3050 },
- { name: '黑龙江', value: 80000 },
- { name: '湖南', value: 2000 },
- { name: '安徽', value: 24580 },
- { name: '山东', value: 40629 },
- { name: '新疆', value: 36981 },
- { name: '江苏', value: 13569 },
- { name: '浙江', value: 24956 },
- { name: '江西', value: 15194 },
- { name: '湖北', value: 41398 },
- { name: '广西', value: 41150 },
- { name: '甘肃', value: 17630 },
- { name: '山西', value: 27370 },
- { name: '内蒙古', value: 27370 },
- { name: '陕西', value: 97208 },
- { name: '吉林', value: 88290 },
- { name: '福建', value: 19978 },
- { name: '贵州', value: 94485 },
- { name: '广东', value: 89426 },
- { name: '青海', value: 35484 },
- { name: '西藏', value: 97413 },
- { name: '四川', value: 54161 },
- { name: '宁夏', value: 56515 },
- { name: '海南', value: 54871 },
- { name: '台湾', value: 48544 },
- { name: '香港', value: 49474 },
- { name: '澳门', value: 34594 }
- ]
- }
- ]
- };
- // 使用刚指定的配置项和数据显示图表。
- myEcharts.setOption(option);
- </script>
- </body>
bar.html
- <!DOCTYPE html>
- <html>
- <head>
- <meta charset="utf-8">
- <title>虚拟柱状图</title>
- <script src="/js/echarts.min.js"></script>
- <script src="/js/jquery-3.5.1.min.js"></script>
- </head>
- <body>
- <div id="main" style="width: 450px;height:200px;"></div>
- <script type="text/javascript">
- var chartDom = document.getElementById('main');
- var myChart = echarts.init(chartDom);
- var option;
-
- // Generate data
- let category = [];
- let dottedBase = +new Date();
- let lineData = [];
- let barData = [];
- for (let i = 0; i < 20; i++) {
- let date = new Date((dottedBase += 3600 * 24 * 1000));
- category.push(
- [date.getFullYear(), date.getMonth() + 1, date.getDate()].join('-')
- );
- let b = Math.random() * 200;
- let d = Math.random() * 200;
- barData.push(b);
- lineData.push(d + b);
- }
- // option
- option = {
- backgroundColor: '',
- tooltip: {
- trigger: 'axis',
- axisPointer: {
- type: 'shadow'
- }
- },
- legend: {
- data: ['line', 'bar'],
- textStyle: {
- color: '#ccc'
- }
- },
- xAxis: {
- data: category,
- axisLine: {
- lineStyle: {
- color: '#ccc'
- }
- }
- },
- yAxis: {
- splitLine: { show: false },
- axisLine: {
- lineStyle: {
- color: '#ccc'
- }
- }
- },
- series: [
- {
- name: 'line',
- type: 'line',
- smooth: true,
- showAllSymbol: true,
- symbol: 'emptyCircle',
- symbolSize: 5,
- data: lineData
- },
- {
- name: 'bar',
- type: 'bar',
- barWidth: 10,
- itemStyle: {
- borderRadius: 5,
- color: new echarts.graphic.LinearGradient(0, 0, 0, 1, [
- { offset: 0, color: '#14c8d4' },
- { offset: 1, color: '#43eec6' }
- ])
- },
- data: barData
- },
- {
- name: 'line',
- type: 'bar',
- barGap: '-100%',
- barWidth: 10,
- itemStyle: {
- color: new echarts.graphic.LinearGradient(0, 0, 0, 1, [
- { offset: 0, color: 'rgba(20,200,212,0.5)' },
- { offset: 0.2, color: 'rgba(20,200,212,0.2)' },
- { offset: 1, color: 'rgba(20,200,212,0)' }
- ])
- },
- z: -12,
- data: lineData
- },
- {
- name: 'dotted',
- type: 'pictorialBar',
- symbol: 'rect',
- itemStyle: {
- color: '#0f375f'
- },
- symbolRepeat: true,
- symbolSize: [12, 4],
- symbolMargin: 1,
- z: -10,
- data: lineData
- }
- ]
- };
-
- option && myChart.setOption(option);
-
- </script>
- </body>
bar-trend.html
- <!DOCTYPE html>
- <html>
- <head>
- <meta charset="utf-8">
- <title>柱状图</title>
- <!-- 引入 echarts.js -->
- <script src="/js/echarts.min.js"></script>
- <script src="/js/jquery-3.5.1.min.js"></script>
- </head>
- <body>
- <!-- 为ECharts准备一个具备大小(宽高)的Dom -->
- <div id="main" style="width: 450px;height:200px;"></div>
- <script type="text/javascript">
-
- var chartDom = document.getElementById('main');
- var myChart = echarts.init(chartDom);
- var option;
-
- let xAxisData = [];
- let data1 = [];
- let data2 = [];
- let data3 = [];
- let data4 = [];
- for (let i = 0; i < 10; i++) {
- xAxisData.push('Class' + i);
- data1.push(+(Math.random() * 2).toFixed(2));
- data2.push(+(Math.random() * 5).toFixed(2));
- data3.push(+(Math.random() + 0.3).toFixed(2));
- data4.push(+Math.random().toFixed(2));
- }
- var emphasisStyle = {
- itemStyle: {
- shadowBlur: 10,
- shadowColor: 'rgba(0,0,0,0.3)'
- }
- };
- option = {
- legend: {
- data: ['bar', 'bar2', 'bar3', 'bar4'],
- left: '10%'
- },
- brush: {
- toolbox: ['rect', 'polygon', 'lineX', 'lineY', 'keep', 'clear'],
- xAxisIndex: 0
- },
- toolbox: {
- feature: {
- magicType: {
- type: ['stack']
- },
- dataView: {}
- }
- },
- tooltip: {},
- xAxis: {
- data: xAxisData,
- name: 'X Axis',
- axisLine: { onZero: true },
- splitLine: { show: false },
- splitArea: { show: false }
- },
- yAxis: {},
- grid: {
- bottom: 100
- },
- series: [
- {
- name: 'bar',
- type: 'bar',
- stack: 'one',
- emphasis: emphasisStyle,
- data: data1
- },
- {
- name: 'bar2',
- type: 'bar',
- stack: 'one',
- emphasis: emphasisStyle,
- data: data2
- },
- {
- name: 'bar3',
- type: 'bar',
- stack: 'two',
- emphasis: emphasisStyle,
- data: data3
- },
- {
- name: 'bar4',
- type: 'bar',
- stack: 'two',
- emphasis: emphasisStyle,
- data: data4
- }
- ]
- };
- myChart.on('brushSelected', function (params) {
- var brushed = [];
- var brushComponent = params.batch[0];
- for (var sIdx = 0; sIdx < brushComponent.selected.length; sIdx++) {
- var rawIndices = brushComponent.selected[sIdx].dataIndex;
- brushed.push('[Series ' + sIdx + '] ' + rawIndices.join(', '));
- }
- myChart.setOption({
- title: {
- backgroundColor: '#333',
- text: 'SELECTED DATA INDICES: \n' + brushed.join('\n'),
- bottom: 0,
- right: '10%',
- width: 100,
- textStyle: {
- fontSize: 12,
- color: '#fff'
- }
- }
- });
- });
-
- option && myChart.setOption(option);
-
-
- </script>
- </body>
bar-negative.html
- <!DOCTYPE html>
- <html>
- <head>
- <meta charset="utf-8">
- <title>柱状图</title>
- <!-- 引入 echarts.js -->
- <script src="/js/echarts.min.js"></script>
- <script src="/js/jquery-3.5.1.min.js"></script>
- </head>
- <body>
- <!-- 为ECharts准备一个具备大小(宽高)的Dom -->
- <div id="main" style="width: 450px;height:200px;"></div>
- <script type="text/javascript">
- var chartDom = document.getElementById('main');
- var myChart = echarts.init(chartDom);
- var option;
-
- option = {
- tooltip: {
- trigger: 'axis',
- axisPointer: {
- type: 'shadow'
- }
- },
- legend: {
- data: ['Profit', 'Expenses', 'Income']
- },
- grid: {
- left: '3%',
- right: '4%',
- bottom: '3%',
- containLabel: true
- },
- xAxis: [
- {
- type: 'value'
- }
- ],
- yAxis: [
- {
- type: 'category',
- axisTick: {
- show: false
- },
- data: ['Mon', 'Tue', 'Wed', 'Thu', 'Fri', 'Sat', 'Sun']
- }
- ],
- series: [
- {
- name: 'Profit',
- type: 'bar',
- label: {
- show: true,
- position: 'inside'
- },
- emphasis: {
- focus: 'series'
- },
- data: [200, 170, 240, 244, 200, 220, 210]
- },
- {
- name: 'Income',
- type: 'bar',
- stack: 'Total',
- label: {
- show: true
- },
- emphasis: {
- focus: 'series'
- },
- itemStyle: {
- emphasis: {
- shadowBlur: 10,
- shadowOffsetX: 0,
- shadowColor: 'rgba(0, 0, 0, 0.5)'
- },
- normal:{
- color:function(params) {
- //自定义颜色
- var colorList = ['#00FFFF', '#00FF00', '#FFFF00', '#FF8C00', '#FF0000', '#FE8463','#6495ed','#ff69b4','#00FFFF', '#00FF00', '#FFFF00', '#FF8C00', '#FF0000', '#FE8463','#6495ed','#ff69b4'];
- return colorList[params.dataIndex]
- }
- }
- },
- data: [320, 302, 341, 374, 390, 450, 420]
- },
- {
- name: 'Expenses',
- type: 'bar',
- stack: 'Total',
- label: {
- show: true,
- position: 'left'
- },
- emphasis: {
- focus: 'series'
- },
- itemStyle: {
- emphasis: {
- shadowBlur: 10,
- shadowOffsetX: 0,
- shadowColor: 'rgba(0, 0, 0, 0.5)'
- },
- normal:{
- color:function(params) {
- //自定义颜色
- var colorList = ['#00FFFF', '#00FF00', '#FFFF00', '#FF8C00', '#FF0000', '#FE8463','#6495ed','#ff69b4','#00FFFF', '#00FF00', '#FFFF00', '#FF8C00', '#FF0000', '#FE8463','#6495ed','#ff69b4'];
- return colorList[params.dataIndex]
- }
- }
- },
- data: [-120, -132, -101, -134, -190, -230, -210]
- }
- ]
- };
-
- option && myChart.setOption(option);
-
- </script>
- </body>
endindex.html
- <!DOCTYPE html>
- <!-- saved from url=(0047)http://yuanbaoshuju.com/bigscreen/17/index.html -->
- <html lang="en" style="font-size: 66.4062px;">
- <head>
- <meta http-equiv="Content-Type" content="text/html; charset=UTF-8">
- <meta http-equiv="X-UA-Compatible" content="IE=edge,chrome=1">
- <meta name="renderer" content="webkit">
- <meta name="viewport" content="width=device-width,initial-scale=1.0,user-scalable=no">
-
- <script type="text/javascript"></script><style type="text/css"></style>
- <link rel="stylesheet" href="./JS/style.css">
- <title>数据仓库可视化展示</title>
-
- </head>
-
- <body>
- <div class="container-flex" tabindex="0" hidefocus="true">
- <div class="box-left">
- <div class="left-top" width="300px" height="200">
- <br/>
- <div class="title-box">
- <h6>销售环</h6>
- </div>
- <div id="html_7">
- <iframe align="center" width="650" height="200" src="k.html" frameborder="no" border="0" marginwidth="0" marginheight="0" scrolling="no"></iframe>
- </div>
- <div class="title-box">
- <h6>商品销售额统计</h6>
- </div>
- <div id="html_1">
- <iframe align="center" width="650" height="200" src="pie.html" frameborder="no" border="0" marginwidth="0" marginheight="0" scrolling="no"></iframe>
- </div>
- <div class="title-box">
- <h6>销量统计</h6>
- </div>
- <div id="html_2">
- <iframe align="center" width="650" height="200" src="index.html" frameborder="no" border="0" marginwidth="0" marginheight="0" scrolling="no"></iframe>
- </div>
- </div>
- </div>
-
- <div class="box-center">
- <div class="center">
- <font size="30" class="center-top">数据仓库可视化展示</font>
- </div>
- <div class="center">
- <div class="title-box">
- <h6></h6>
- </div>
- <div class="title-box">
- <h6></h6>
- </div>
- <div id="html_3">
- <iframe align="center" width="650" height="300" src="line.html" frameborder="no" border="0" marginwidth="0" marginheight="0" scrolling="no"></iframe>
- </div>
- <div class="title-box">
- <h6></h6>
- </div>
- <div id="html_5">
- <iframe align="center" width="650" height="300" src="map.html" frameborder="no" border="0" marginwidth="0" marginheight="0" scrolling="no"></iframe>
- </div>
- </div>
- </div>
-
- <div class="box-right">
- <div class="right-top">
- <br/>
- <div class="title-box">
- <h6>虚拟消费</h6>
- </div>
- <div id="html_6">
- <iframe align="center" width="650" height="200" src="bar.html" frameborder="no" border="0" marginwidth="0" marginheight="0" scrolling="no"></iframe>
- </div>
- <div id="html_8">
- <iframe align="center" width="650" height="200" src="bar-trend.html" frameborder="no" border="0" marginwidth="0" marginheight="0" scrolling="no"></iframe>
- </div>
- <div id="html_9">
- <div class="title-box">
- <h6>收益情况</h6>
- </div>
- <iframe align="center" width="650" height="200" src="bar-negative.html" frameborder="no" border="0" marginwidth="0" marginheight="0" scrolling="no"></iframe>
- </div>
- </div>
- </div>
- </div>
-
- <script type="text/javascript" src="./JS/china.js"></script>
-
- </body>
- </html>
5.4测试
1)运行项目
2)进入浏览器
http://localhost:8080/endindex.html
说明:为了偷懒,只有pie.html, index.html, line.html调用了mysql的数据,其他的数据是手敲的。
注:
http://localhost:8080/加上HTML的文件名都能够查看相应的图!
要码源的私聊我
作者水平低,如有错误,恳请指正!谢谢!!!!!
原文链接:https://blog.csdn.net/qq_55906442/article/details/125683834
所属网站分类: 技术文章 > 博客
作者:hhbnn
链接:http://www.phpheidong.com/blog/article/546632/e7e1d498e4436c6c42d5/
来源:php黑洞网
任何形式的转载都请注明出处,如有侵权 一经发现 必将追究其法律责任
昵称:
评论内容:(最多支持255个字符)
---无人问津也好,技不如人也罢,你都要试着安静下来,去做自己该做的事,而不是让内心的烦躁、焦虑,坏掉你本来就不多的热情和定力